What prompts are (and why they matter)
Prompts are the questions Meridian tracks across AI platforms. They define what you are measuring. A helpful way to think about prompts is: “What are the queries we want to show up more for in AI search?” Meridian reports on (and help you improve visibility) for the prompts you track. If you track the right prompts, you get a clear view of:- where you are being recommended today,
- where competitors are winning,
- and which actions (content, off-page, website fixes) are most likely to increase visibility over time.
How often prompts run (daily)
Meridian runs each tracked prompt once per day across the AI platforms/models enabled in your account. This daily cadence is important because AI answers can vary day to day, so you want enough repeated runs to see real trends instead of one-off noise.Choosing the right prompts matters (a lot)
It is completely normal, and often more valuable, to add prompts where you currently have no or low visibility, especially higher-funnel “best X”, “top X”, and comparison prompts. Try to avoid building a prompt set that is mostly:- too branded (e.g., “Is [Your Brand] good?”, “What is [Your Brand]?”), or
- too company-specific (queries only someone who already knows you would ask).
- discovery prompts (“best __”, “top __”, “___ alternatives”),
- comparison prompts (“__ vs __”),
- use-case prompts (“__ for beginners”, “__ for [specific need]”),
- and a smaller set of branded prompts for monitoring reputation.
What you can do in Prompts
Prompts is designed for four core workflows:- Build a prompt set that matches how customers ask AI for recommendations.
- Organize prompts into Topics so you can evaluate performance by category/product line.
- Tag prompts with Attributes so you can filter and segment.
- Diagnose performance using Analyze and run-level evidence.
How the Prompts table is structured
Each row in the table is a prompt you are tracking. For each prompt, Meridian shows:- Topic: the category the prompt belongs to.
- Visibility score: how often your brand is mentioned for this prompt.
- Share of voice: your share of mentions compared to tracked brands.
- Prominence: your average rank when mentioned (lower is better).
Adding prompts (three ways)
Click Add prompts to open the menu. You can add prompts in three ways:- Add Prompt (one at a time)
- Add Topic (create a topic and optionally auto-generate prompts)
- Upload CSV (bulk import)
1) Add Prompt
Use Add Prompt when you are adding a handful of high-value prompts manually. You can set:- the prompt text,
- the topic,
- optional attributes.
2) Add Topic (and auto-generate prompts)
Use Add Topic when you want to scale quickly. A topic is usually a category or product line. You can optionally enable Generate 10 relevant prompts for this topic, which is a fast way to create a baseline prompt set for that category.3) Upload CSV
Use Upload CSV when you already have a prompt library and want to import at scale. The upload modal lists required and optional columns. In the UI shown:- Required columns:
prompt,topic - Optional columns:
attributeId,attributeValue
Time range and previous period comparison
At the top of the Prompts tab you can set:- a date range (for example: Last 7 days),
- and compare against Prev. Period.
Filters (scoping your analysis)
Filters narrow the dataset you are looking at. Use filters when you want to answer questions like:- “How are we doing on ChatGPT only?”
- “Which prompts in Topic X are consistently missing us?”
- “How are we doing on a specific segment of prompts (attributes)?”
If the table looks empty after filtering, widen your time range first and then remove filters one-by-one. Empty states are most often caused by overly narrow filters or small sample sizes.
Group by: Topic (and why it matters)
Prompts supports grouping so you can evaluate performance at a higher level than a single prompt.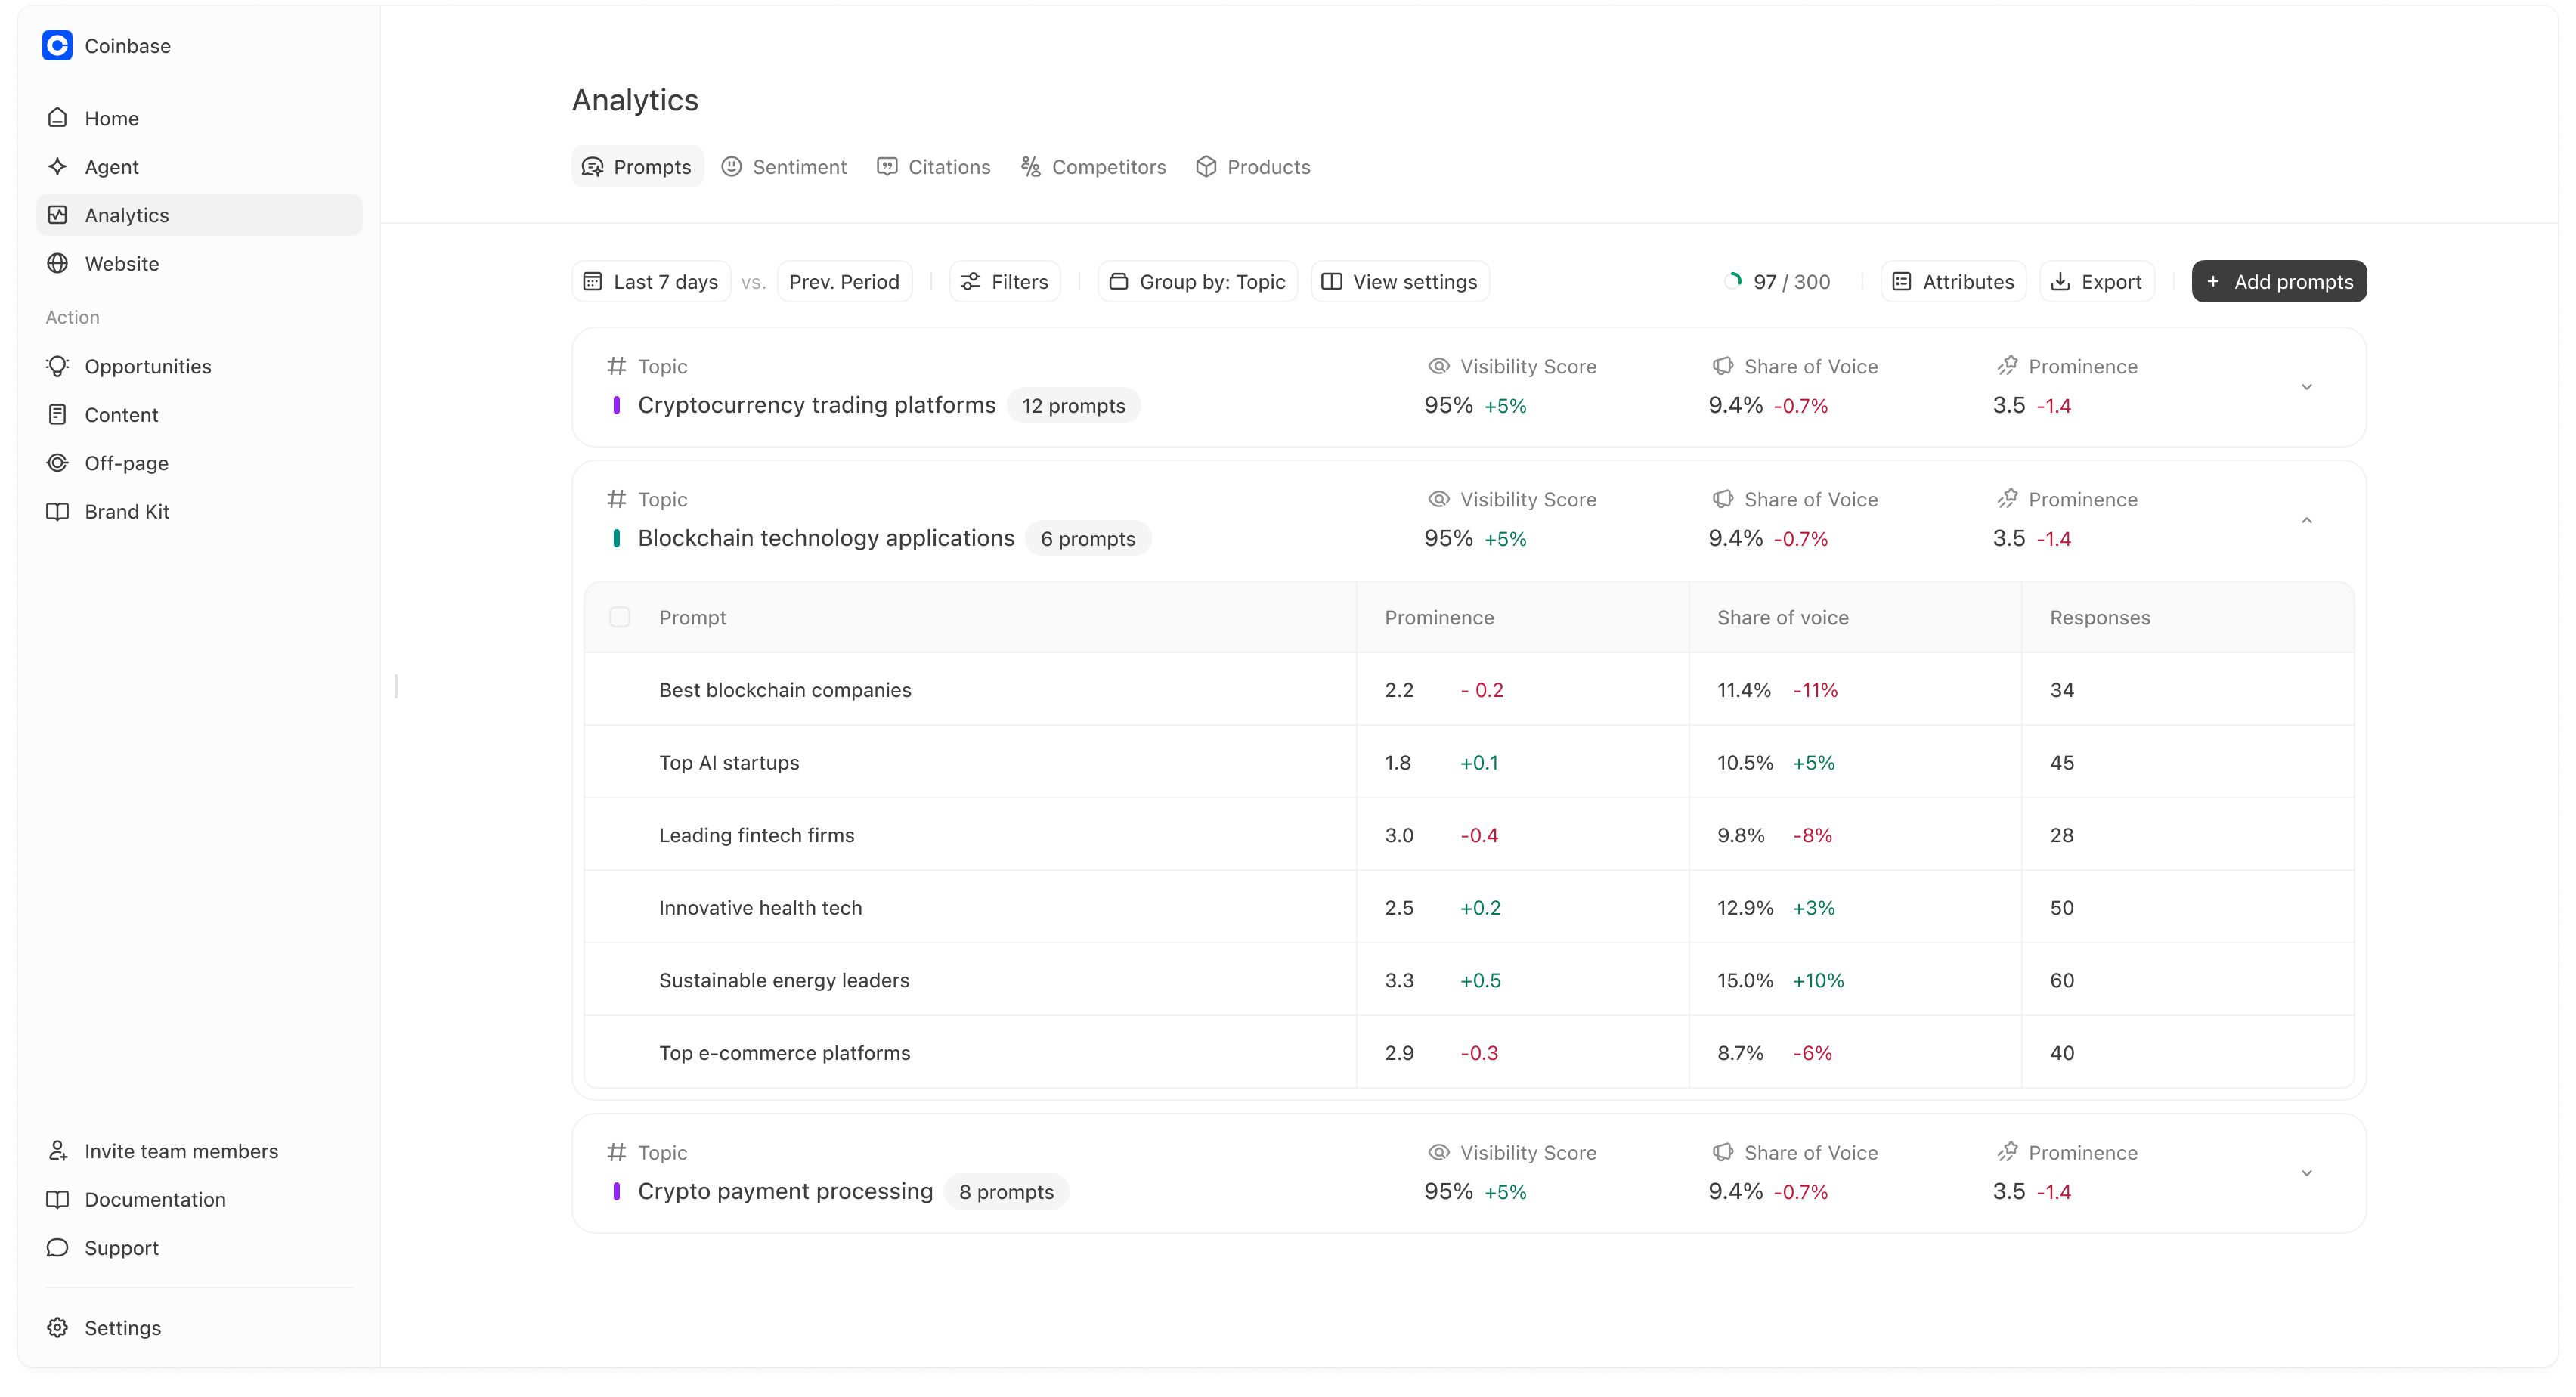
- “Which categories are we winning?”
- “Where are we consistently missing or ranked low?”
- “Which topic should we invest in next?”
- visibility score,
- share of voice,
- prominence,
How to use topic rollups
- If a topic has strong visibility but weak prominence, you are being included but not preferred. That usually calls for better comparisons, proof, and citations for that topic.
- If a topic has low visibility, you likely have a coverage or authority gap for that category.
View settings
View settings lets you change how the table is displayed (for example, which columns you see). Use it to keep the table focused on the metrics your team cares about.Prompt usage and limits
At the top right you may see a usage indicator like “97 / 300 prompts.” This shows how many prompts you are tracking relative to your plan limit.Exports
Use Export when you want to share performance with teammates or archive a reporting snapshot.Attributes (segmentation)
Attributes allow you to tag prompts so you can filter and compare different slices of your prompt set. Examples:- Intent: Research vs Decision
- Audience: Beginner vs Expert
- Internal: Campaign tags
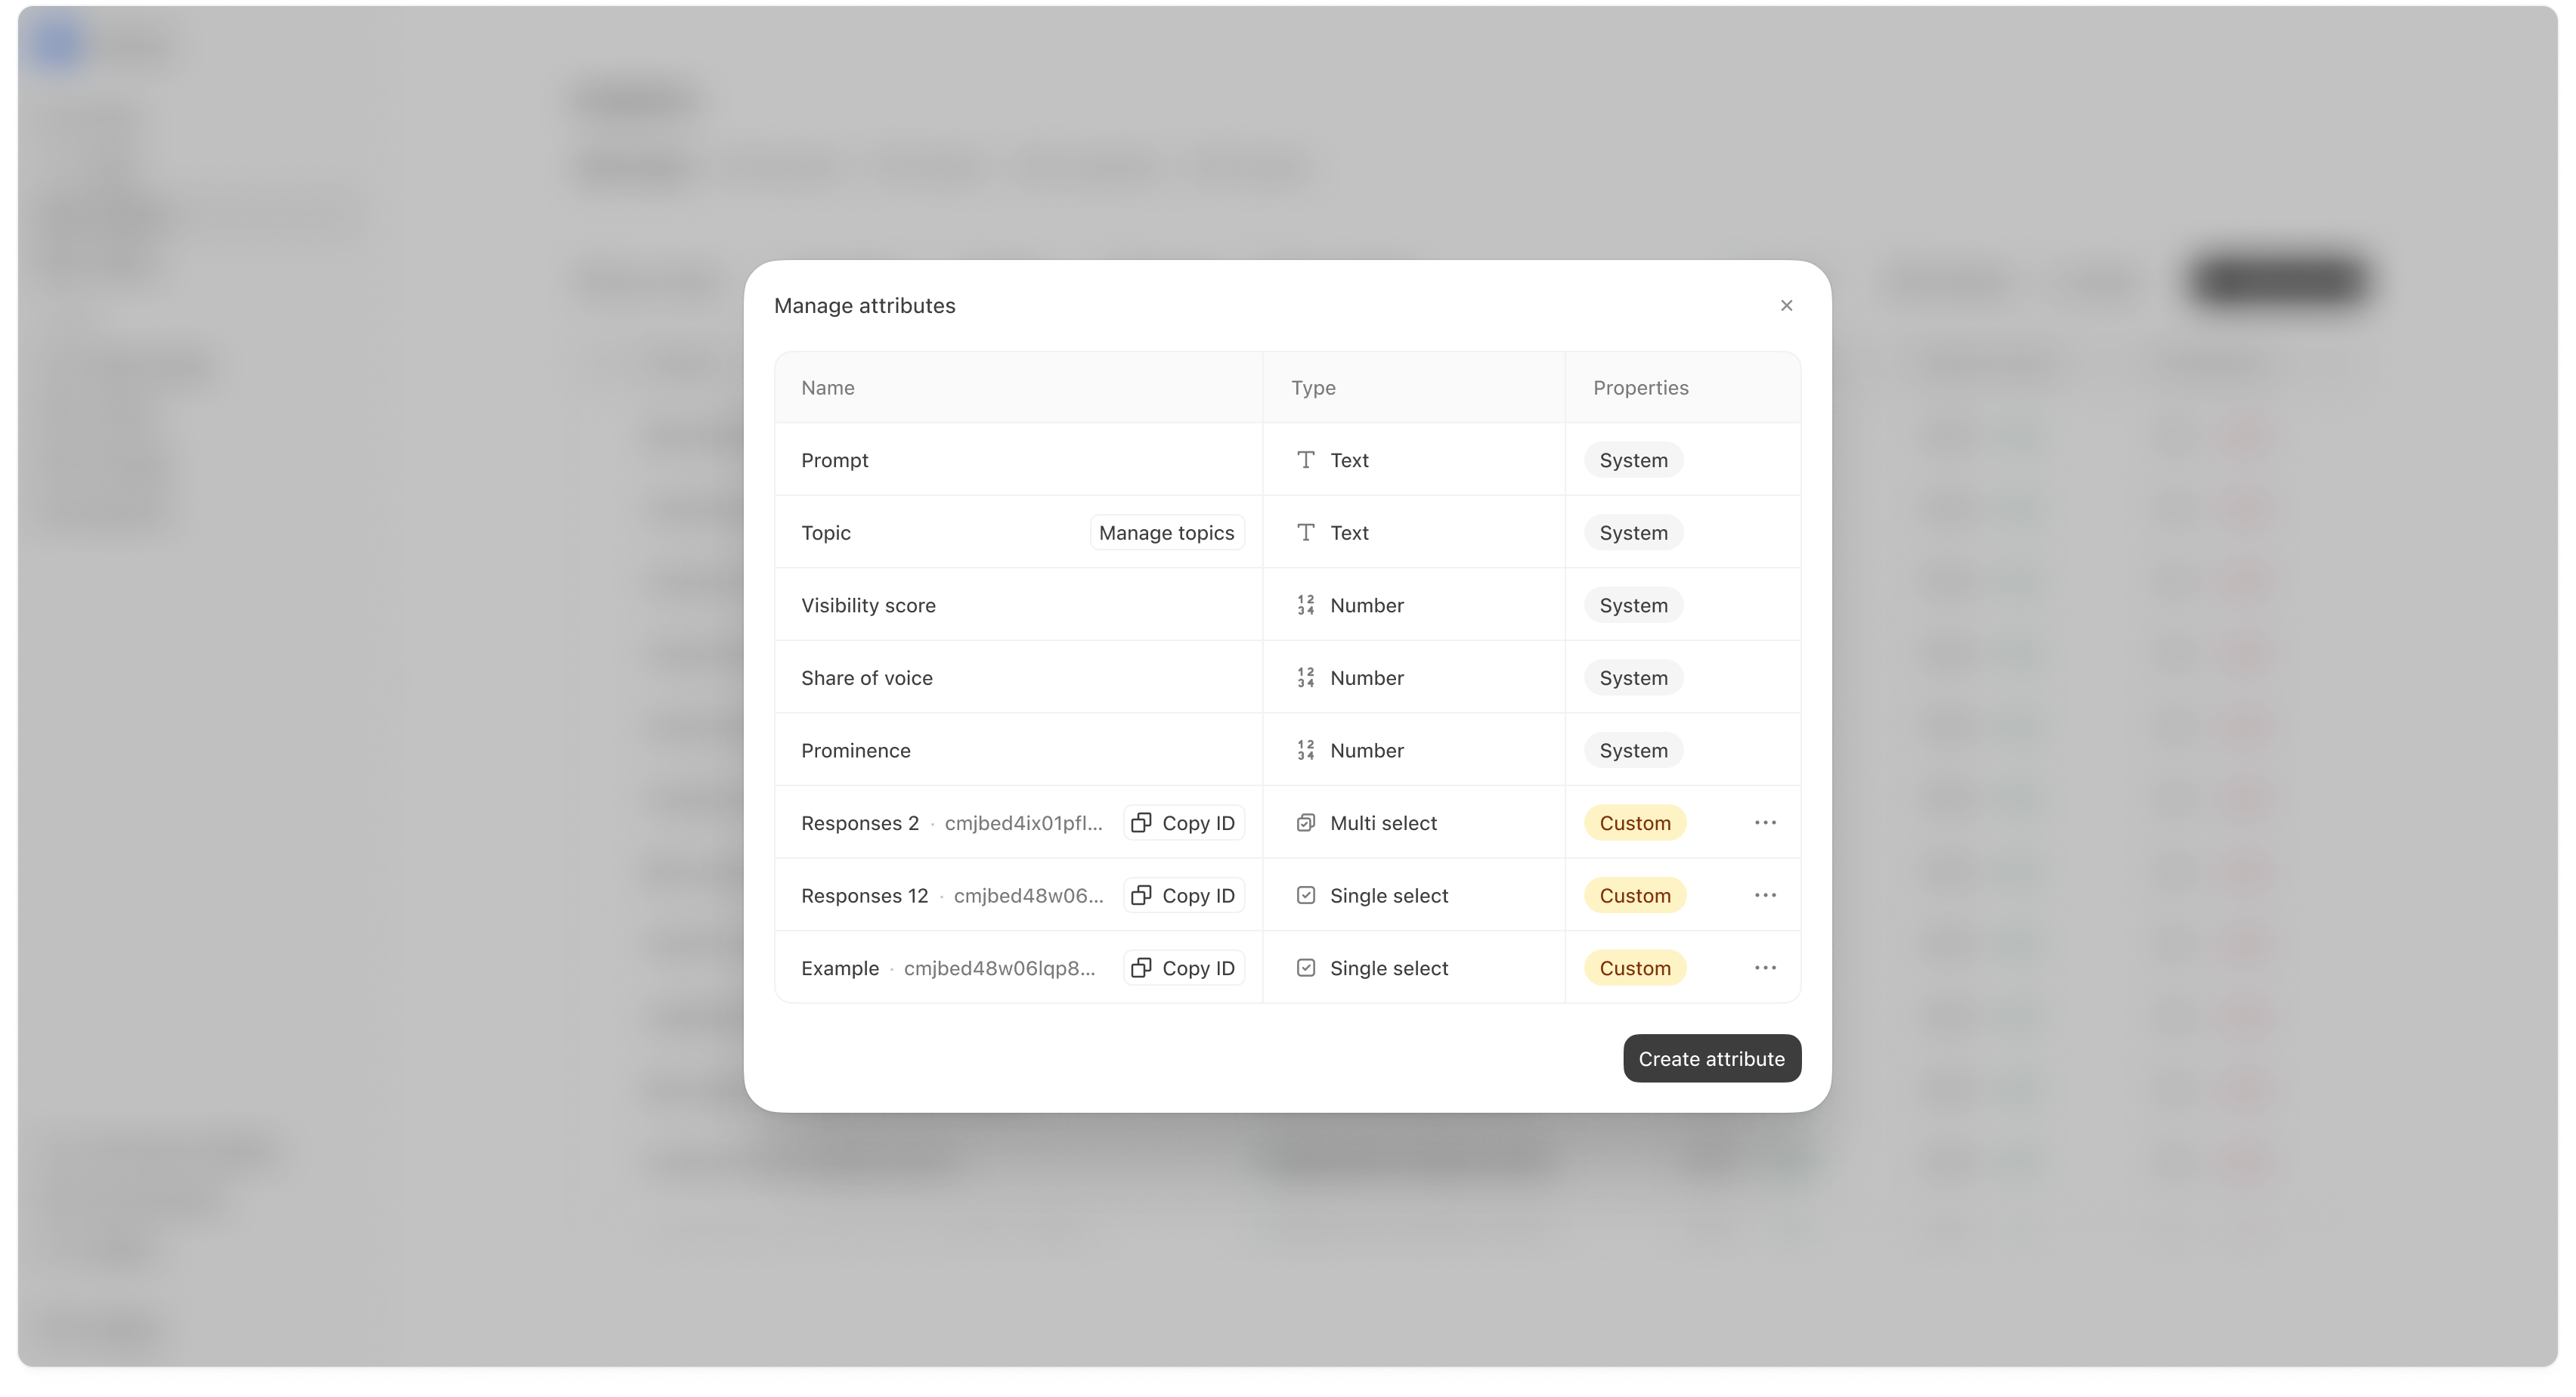
Creating a new attribute
You can create custom attributes with types like:- Text
- Number
- Single select
- Multi select
Analyze (run-level evidence)
Analyze is where you stop looking at aggregate scores and inspect what actually happened in the underlying AI responses. Use Analyze when:- a prompt is important and you want to understand why you are winning or losing,
- you see a sudden change in visibility or prominence,
- you want to compare platform performance (ChatGPT vs Gemini vs Perplexity),
- or you want to see which sources are being cited in the answers.
How to open Analyze
From Analytics → Prompts, click Analyze on a specific prompt (or open the prompt row if your UI opens analysis directly). Once you open Analyze, you’ll see three layers of detail:- platform-level performance,
- trend over time,
- and the run table (the evidence).
.png?fit=max&auto=format&n=rYczNohu6rIxUsD8&q=85&s=f586d044437e521677acd007e1e8a833)
Platform Breakdown
The Platform Breakdown chart shows how performance differs by platform. This matters because different platforms rely on different sources and can return different ranked lists.How to interpret Platform Breakdown
- If one platform is much lower, you often need a platform-specific plan (usually citations/off-page).
- If one platform is high and others are low, your content and source ecosystem likely match the “high” platform better than the others.
Brand Visibility trend
The Brand Visibility chart shows visibility over time for the selected prompt. It helps you spot:- when a drop began,
- whether changes are consistent or noisy,
- and whether there are clear competitor-driven shifts.
How to use the trend
- A one-day dip is often noise.
- A sustained dip across multiple days is usually a real change worth investigating.
Response table (the evidence)
The response table shows each run for the prompt, including:- Date
- Mentioned (Yes/No)
- Position (if mentioned)
- All mentions (icons showing which brands/products appeared)
- Response snippet
- Platform
- Region
How to interpret the run table
- If you have many Not mentioned rows, you have a coverage/authority gap for this prompt.
- If you are mentioned but positions are #4+, you are included but not preferred. That often points to positioning, proof, or citation gaps.
- If performance varies widely by platform, focus your investigation on the weaker platform’s runs first.
Opening a response (Mention details)
Click a response row to open the detailed response modal. This is where you can see the full answer, mentions, shopping output (if available), and citations.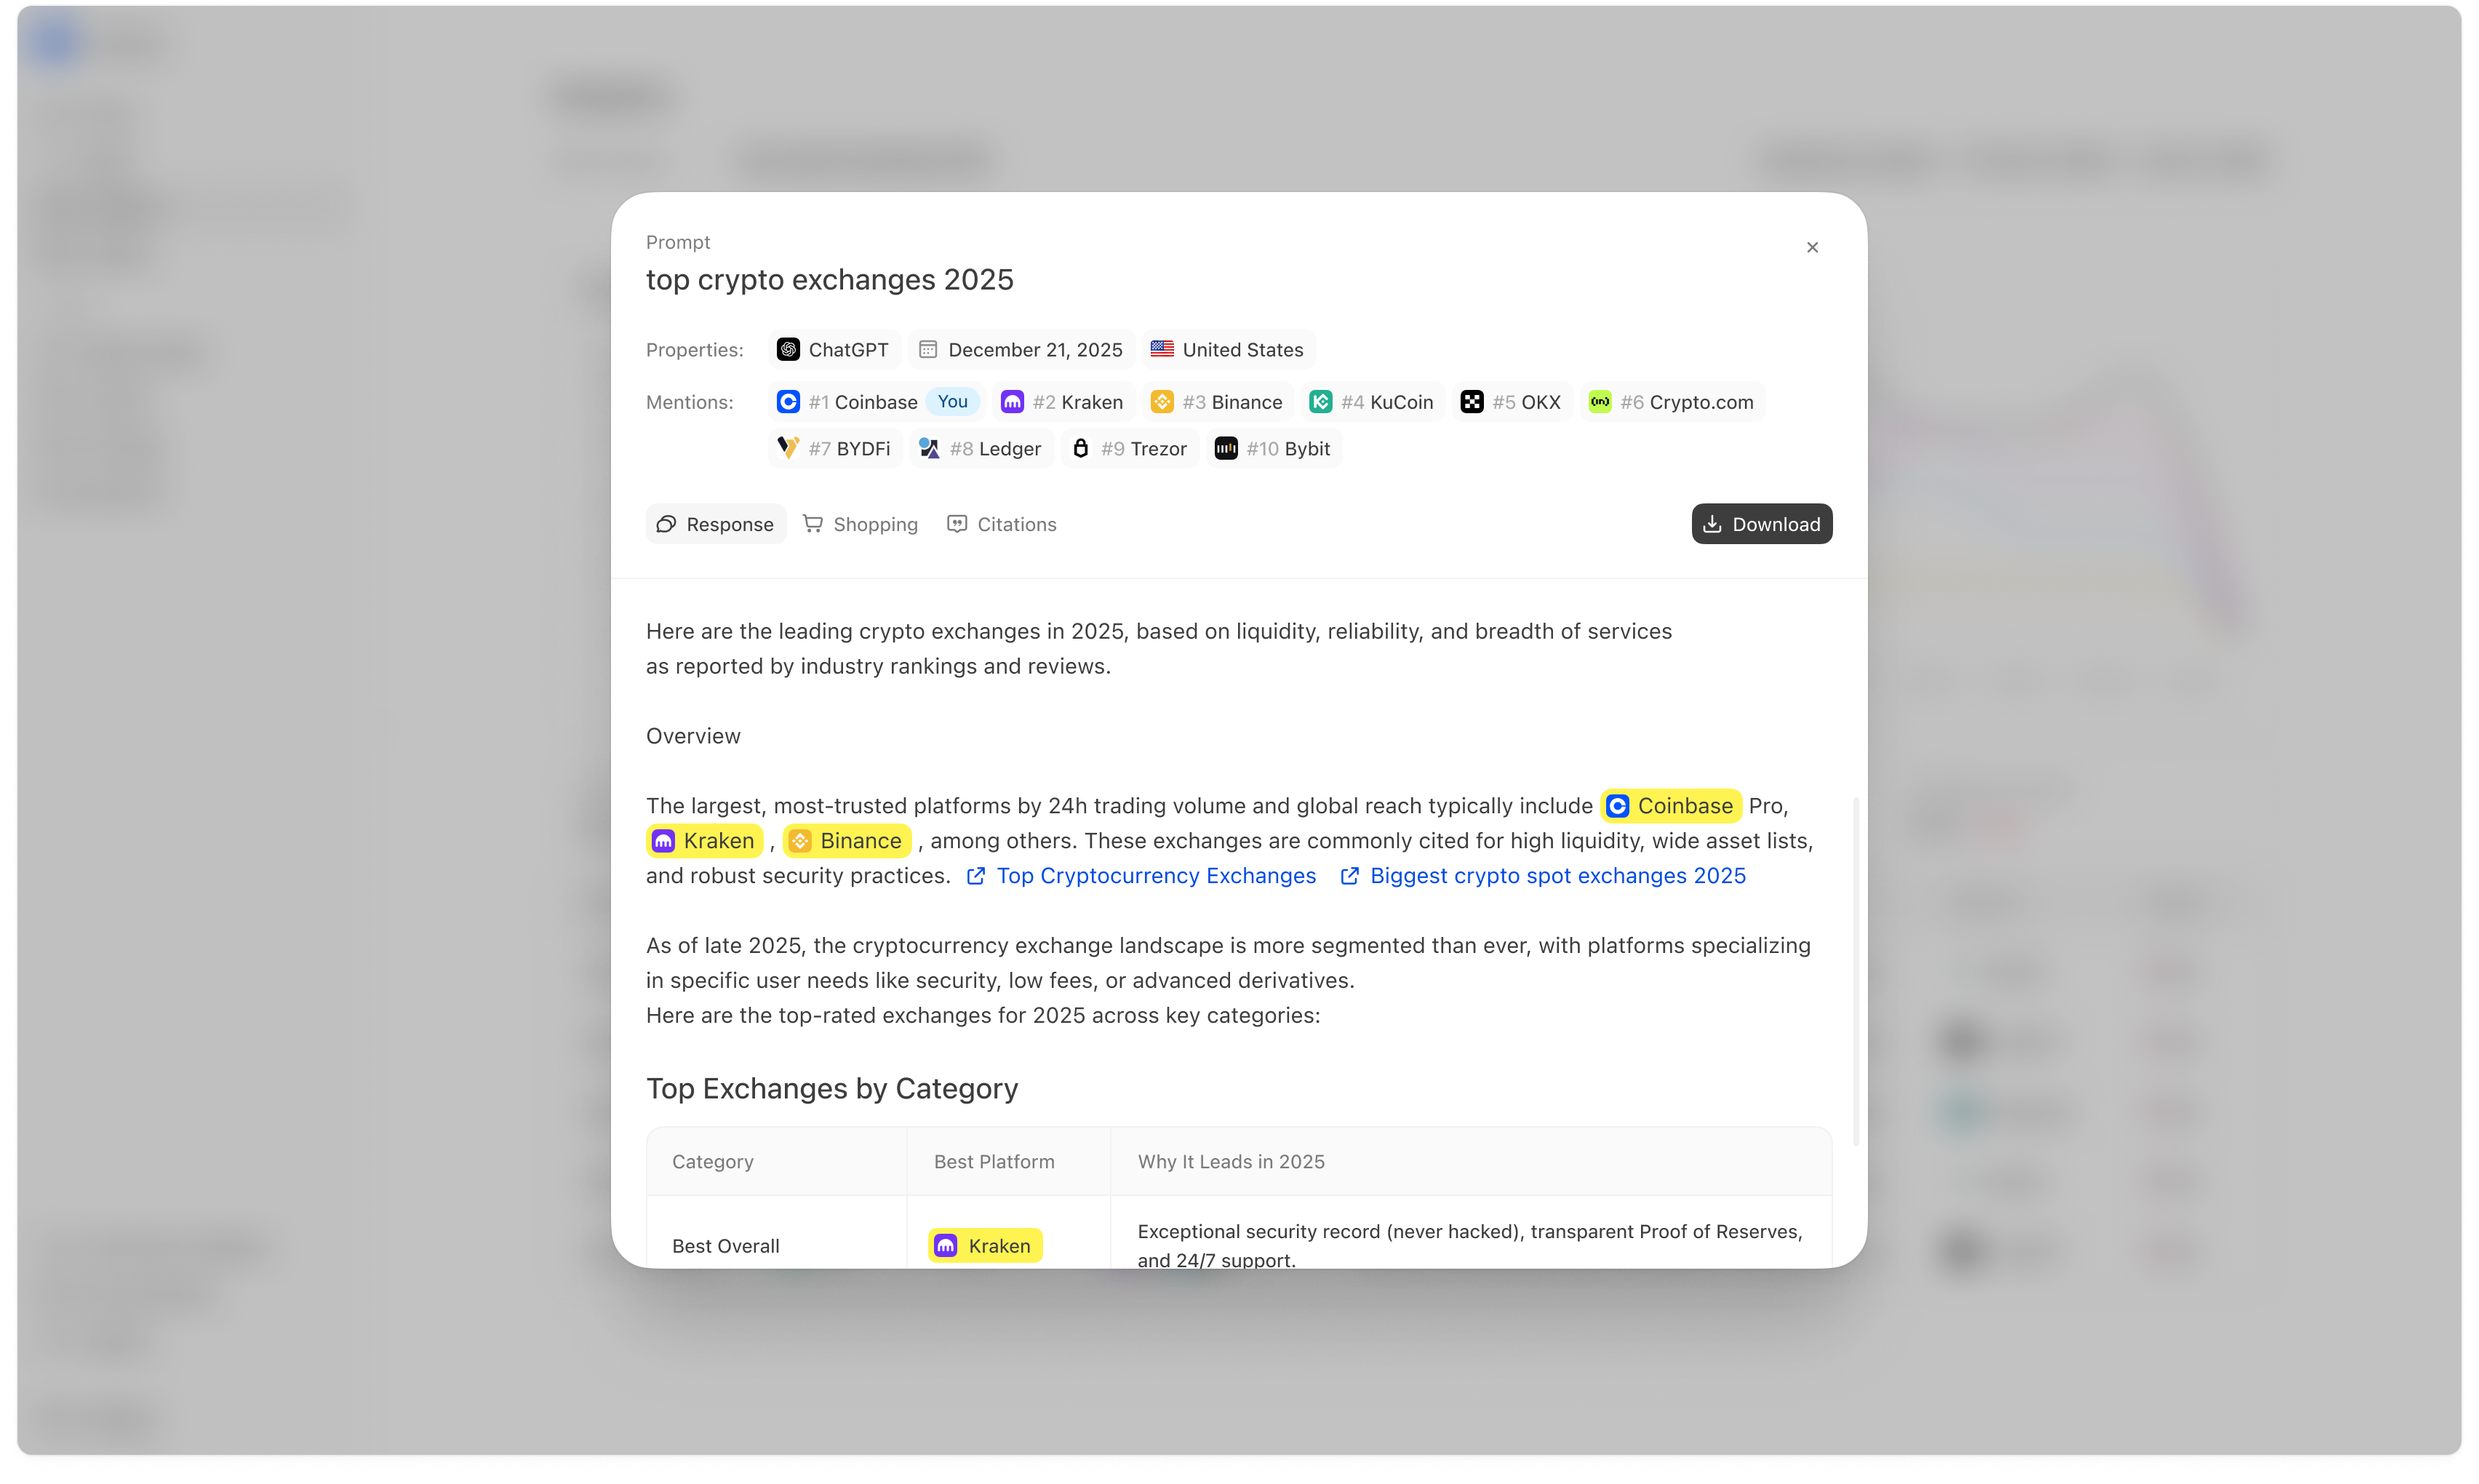
What you see at the top
- Prompt name
- Properties (platform, date, region)
- Mentions list (ranked entities)
- whether you were included,
- who outranked you,
- and which competitors appear in the same answers.
Response tab
The Response tab shows the full answer text. This is useful for understanding:- what criteria the answer uses,
- how the answer frames the category,
- and what “proof” it relies on (often reflected in citations).
Shopping tab (when available)
Some prompts produce a shopping-style output, such as products with images, prices, and retailers. The Shopping tab shows that view when it is present. If Shopping output exists for your category, it can change the strategy:- product page structure matters more,
- and citations/sources can influence which products appear.
Citations tab
The Citations tab shows the sources referenced in the answer (domains/URLs). This is often the most actionable part of a run because it tells you what the model trusted when forming the answer.How to use citations in a losing run
If a competitor outranks you and the answer cites a specific editorial page or domain, that source is often a high-leverage target for:- Off-page → Outreach (earn inclusion), or
- improving your own source pages so you can be cited instead (Website → Pages), or
- publishing content aligned to what the source covers (Opportunities / Content).
Run-level citations often explain why prominence is low even when visibility is high. If your pages are not in the citation ecosystem, it is difficult to hold top ranks consistently.